
How to Read a PID Correction Factor Chart
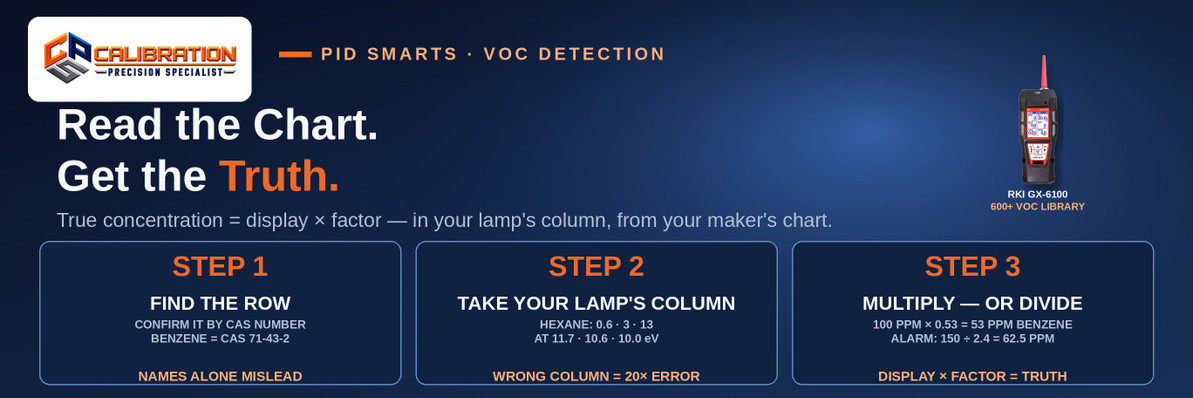
To read a PID correction factor chart, find your vapor’s row, take the factor under your own lamp energy — not another lamp and not another maker’s chart — and multiply: true concentration = display × factor, so a 100 ppm isobutylene-equivalent reading is 53 ppm of benzene at a factor of 0.53 (10.6 eV, RAE TN-106), 50 ppm of toluene at 0.50, or 430 ppm of hexane at 4.3; to set an alarm instead, divide the exposure limit by the factor.
Our companion post, PID Correction Factors Explained, covers why the factor exists. This post is the hands-on skill that post never taught: how to open an actual chart, find the right cell in it, and run the arithmetic in both directions — forward to a true concentration, and backward to an alarm setpoint. Get the cell wrong and every number after it is wrong, confidently.
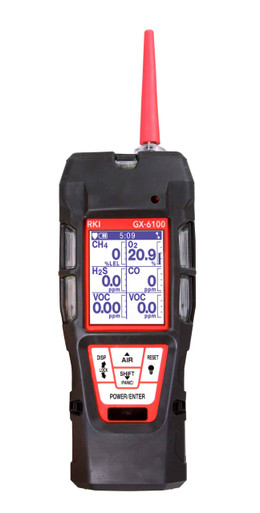
RKI GX-6100 Pumped 6-Gas Monitor – PID, VOC & Multi-Gas
Pumped 6-gas monitor with PID lamps at 10.0, 10.6 and 11.7 eV and a built-in VOC library that applies the factor for you.
$1,357.45–$4,425.95 configured
See the GX-6100What Are the Three Moves in Reading the Chart?
Move 1 — find the row by name and CAS number. Charts list hundreds of compounds alphabetically, often under a synonym. Benzene is also listed by CAS 71-43-2; if two names look alike (hexane vs. heptane, propanol vs. propylene), the CAS number is the tiebreaker. Never work from a row you only think is yours.
Move 2 — take the column for your lamp. Most charts print one factor column per lamp energy — typically 11.7, 10.6 and 10.0 eV, in that order on the RKI/ION Science chart. A factor is only valid for the lamp it was measured under. Benzene reads 0.53 at 11.7 eV, 0.50 at 10.6 eV and 0.54 at 10.0 eV on that chart: close, but not interchangeable, and for other compounds the columns diverge sharply — hexane is 0.6 at 11.7 eV, 3 at 10.6 eV and 13 at 10.0 eV. Reading the wrong column can be a twenty-fold error. If your lamp cannot ionize the compound at all, the chart says so: look for ZR (zero response), NR (no response) or a blank, and treat it as “this lamp cannot see this vapor,” not as a factor of zero. Our lamp-energy guide shows which vapors each lamp can see at all.
Move 3 — multiply the reading, or divide the limit. True concentration = displayed reading × factor. That is the whole forward calculation. The backward calculation — the one safety work actually runs on — is in the alarm section below.
Worked Example: A 100 ppm Reading, Three Different Truths
All three examples use the standard 10.6 eV lamp and Honeywell RAE’s Technical Note TN-106, the chart our earlier post used, so the two posts agree number for number:
| Vapor (10.6 eV, TN-106) | Factor | 100 ppm display really means | Why |
|---|---|---|---|
| Benzene | 0.53 | 53 ppm | Ionizes more readily than isobutylene — the PID over-responds, so the truth is lower than the display |
| Toluene | 0.50 | 50 ppm | Same story: a strong responder, half the display |
| n-Hexane | 4.3 | 430 ppm | A weak responder — the truth is more than four times the display |
| Ammonia | 9.7 | 970 ppm | Very weak PID response — a modest display can hide a large concentration |
| Isobutylene (the calibration gas) | 1.00 | 100 ppm | By definition: the reference every factor is measured against |
The rule of thumb: a factor below 1 means the display flatters the hazard downward in your favor — the real concentration is lower. A factor above 1 means the display understates the hazard, and the larger the factor, the larger the hidden multiplier. A factor near 10, like ammonia’s, also means poor effective resolution: small display changes are large real changes.
How Do You Run the Alarm Math Backward?
Alarms trip on the display, but exposure limits are written in the true gas. So convert the limit into display units before you set anything:
Display alarm = exposure limit ÷ factor.
MSA’s own response-factor table works the identical example: butyl acetate’s TLV-TWA is 150 ppm and its factor on the ALTAIR 5X PID (10.6 eV) is 2.4, so the limit in isobutylene equivalents is 150 ÷ 2.4 = 62.5 ppm on the display. If you set the alarm at 150 on the display instead, the instrument would not alarm until the true concentration reached 360 ppm — more than double the limit. TN-106’s worked examples run the same division for TWA and STEL values. Two cautions: use the limit and the factor from consistent sources, and remember that many modern instruments do this internally when you select the target gas from the built-in library — the RKI GX-6100 carries a 600+ compound VOC library on its 10.6 eV PID, and the SENKO V-PRO applies its 10.6 eV factors the same way. Verify the library is actually selected before you trust the display to be the true gas.
Why Must the Chart Match Your Instrument’s Maker?
Because the charts do not agree with each other. Same vapor, same 10.6 eV lamp, different makers’ published factors:
| Vapor (10.6 eV) | RAE TN-106 | RKI / ION Science chart | MSA ALTAIR 5X table |
|---|---|---|---|
| Benzene | 0.53 | 0.50 | — |
| Acetone | 1.1 | 1.17 | 1.2 |
| n-Hexane | 4.3 | 3.0 | — |
| Butyl acetate | 2.6 | — | 2.4 |
These are not typos. Lamp geometry, sensor design and test conditions differ by instrument, and Honeywell itself advises users to use the factor in their instrument’s own firmware library over the generic TN-106 table when the two differ, precisely because lamp and sensor sizes vary across a product family. The practical rule is simple: use your instrument maker’s chart, for your lamp, at your firmware’s values where they exist — and never borrow a factor from another brand’s chart because it was the first PDF Google found. Factors are also approximate by the makers’ own statements (commonly around ±20%), they were typically measured at 100 ppm or less in dry air, and humidity, lamp fouling and concentration can move them. When accuracy matters — a clearance decision, an exposure record — calibrate with the actual target gas instead of any chart.
Where Do You Find Each Maker’s Own Chart?
Verified live on November 21, 2026. Four makers publish a standalone chart we could verify; a fifth on Derek’s original list could not be verified and is noted honestly below.
- RKI Instruments — PID Sensor Response Factors chart (11.7 / 10.6 / 10.0 eV columns, sourced from NIST ionization energies): RKI PID response chart (PDF). This is the chart to use for RKI instruments such as the GX-6100.
- ION Science — Technical Article TA-02, PID Response Factors for 900+ volatiles across 10.0, 10.6 and 11.7 eV lamps: ION Science PID Response Factors (PDF).
- RAE Systems (Honeywell) — Technical Note TN-106, Correction Factors, Ionization Energies and Calibration Characteristics: RAE TN-106 (PDF). Use it for RAE instruments — not as a universal table for other brands.
- MSA — PID Response Factor Table in the ALTAIR 5X PID operating manual, with the explicit warning that its factors are specific to the designated lamp energy and are not valid for any other lamp: MSA ALTAIR 5X PID Response Factor Table.
- Dräger — not listed, because we could not verify one. We searched for a standalone public Dräger PID correction-factor chart on November 21, 2026 and did not find one we could verify returning live; Dräger PID instruments carry their measurement-gas library in the instrument. If Dräger publishes a standalone chart, we will add it here — we will not link to a chart we cannot verify.
Whichever chart you use, it only works on a properly calibrated instrument. A PID is calibrated on isobutylene — see calibration gas for PID instruments for the cylinder, connections and shelf life — and a fouled lamp shifts every factor’s result before the arithmetic even starts.
What Can a Chart Never Tell You?
Three limits, stated plainly. First, mixtures: a PID reads the sum of everything ionizable in the sample. A single factor is only honest when one known vapor dominates; for a known mixture, the combined factor is CFmix = 1 / (X1/CF1 + X2/CF2 + …), using each component’s mole fraction — TN-106’s example, 5% benzene and 95% n-hexane, gives a combined factor of 3.2. For an unknown mixture, the honest label for the reading is “isobutylene equivalents,” full stop. Second, invisible vapors: no factor fixes a vapor above your lamp energy — it reads zero at any factor. Third, conditions: high humidity can depress PID response substantially (mPower’s technical note puts it at roughly 40% near 100% RH), and methane or propane above about 1% by volume can quench response. A chart assumes a clean lamp, dry-ish air and a known vapor.
Frequently Asked Questions
How do you read a PID correction factor chart?
Find your vapor’s row (confirm it by CAS number), take the factor in the column for your lamp energy, and multiply the displayed reading by that factor. Example at 10.6 eV from RAE TN-106: a 100 ppm display × benzene’s 0.53 factor = 53 ppm of benzene. Never use another lamp’s column or another maker’s chart.
What is the formula for a PID correction factor?
True concentration = displayed reading × correction factor. The display is in isobutylene equivalents because the PID was calibrated on isobutylene (factor 1.00 by definition). To convert an exposure limit into a display alarm instead, divide: display alarm = limit ÷ factor.
What does a correction factor below 1 mean on a PID?
The vapor ionizes more readily than isobutylene, so the PID over-responds and the true concentration is lower than the display. Benzene (0.53) and toluene (0.50) at 10.6 eV in TN-106 are the classic examples: a 100 ppm display is 53 ppm and 50 ppm respectively.
What does a correction factor above 1 mean on a PID?
The vapor responds weakly, so the true concentration is higher than the display — sometimes much higher. At 10.6 eV in TN-106, n-hexane’s factor is 4.3 (a 100 ppm display is 430 ppm) and ammonia’s is 9.7 (a 100 ppm display is 970 ppm). Large factors also mean coarse effective resolution.
Can you use one manufacturer’s PID correction factors on another brand’s instrument?
No. Published factors for the same vapor and lamp differ by maker — n-hexane at 10.6 eV is 4.3 in RAE TN-106 but 3.0 in the RKI/ION Science chart, and acetone is 1.1, 1.17 and 1.2 across the RAE, ION and MSA tables. Honeywell itself directs users to their instrument’s own firmware library over the generic table. Use your maker’s chart for your lamp.
How do you set a PID alarm using a correction factor?
Divide the exposure limit by the factor to get the alarm in display (isobutylene-equivalent) units. MSA’s worked example: butyl acetate’s TLV-TWA of 150 ppm ÷ its ALTAIR 5X factor of 2.4 = a 62.5 ppm display alarm. Setting 150 on the display would not alarm until 360 ppm true — over twice the limit.
What does ZR or NR mean on a PID correction factor chart?
ZR means zero response and NR means no response for that compound at that lamp energy: the lamp cannot ionize the vapor, so it will read zero regardless of concentration. It is not a factor to multiply by. Switch to a higher-energy lamp if one exists for that vapor, or use a different sensing technology.
Do PID correction factors change with the lamp?
Yes — the factor is measured per lamp energy, which is why charts print separate 11.7, 10.6 and 10.0 eV columns. On the RKI/ION chart, hexane is 0.6 at 11.7 eV, 3 at 10.6 eV and 13 at 10.0 eV. Always read the column that matches the lamp actually fitted.
How accurate are PID correction factors?
Approximate. Makers describe them as approximate, commonly around ±20%, typically measured at 100 ppm or less in dry air at room temperature. Humidity, lamp fouling, concentration and background gases can move the result. When the number must be defensible — clearance or exposure records — calibrate with the actual target gas instead of relying on a chart.
What correction factor do you use for a mixture of vapors?
For a mixture of known composition, combine the factors by mole fraction: CFmix = 1 / (X1/CF1 + X2/CF2 + …). TN-106’s example — 5% benzene, 95% n-hexane — gives 3.2. If the mixture is unknown, no single factor is honest: report the reading as isobutylene equivalents.
The Bottom Line
A correction factor chart is three moves: the right row, confirmed by CAS; the right column, for the lamp actually fitted; and the right maker’s table, because the makers’ numbers genuinely differ. Multiply to get the truth from a reading, divide to get an alarm from a limit, and treat ZR as “invisible to this lamp,” not as zero gas. Do that, and a PID’s isobutylene-equivalent display becomes a defensible measurement of the vapor you actually have. Skip any one of the three, and the number on the screen is precise, digital — and wrong.
Need a calibration you can file?
In-house calibration at CPS in Rockwood, Tennessee — $55 for single-gas instruments, $90 for 4- and 5-gas — every channel, as-found and as-left data, full certificate.
See Calibration Servicesor call 865-900-8844
Recent Posts
-

How to Read a PID Correction Factor Chart
To read a PID correction factor chart, find your vapor’s row, take the factor under your own lamp en …Nov 21st 2026 -

PID Lamp Energies: 10.0 vs. 10.6 vs. 11.7 eV — Which Lamp Sees Your Vapor?
A photoionization detector (PID) can only detect a vapor whose ionization energy is below its lamp e …Nov 20th 2026 -

Catalytic Bead vs. Infrared vs. Hydrocarbon Sensors: What Can Each LEL Sensor Detect?
A catalytic bead LEL sensor detects almost any combustible gas — including hydrogen — but it needs o …Nov 19th 2026